- Extract the file.
The iPod nano must have disk mode enabled. Assuming MacOSX, extract the file: 
/Volumes/iPod name/iPod_Control/Device/Trainer/Workouts/Empeds/ID of footpod/synched/Date Time.xml(where iPod name and ID of footpod are installation-specific). - Identify the part of the file that contains the raw data.
For example:
<extendedDataList>%ltextendedData dataType="distance" intervalType="time" intervalUnit="s" intervalValue="10">0.0, 0.0141, 0.0337, 0.0702, 0.0917, 0.1221, 0.1556, 0.1887, 0.2211, 0.2508, 0.2813, 0.3122, 0.3402, 0.3723, 0.4045, 0.4361, 0.4647, 0.4968, 0.5274, 0.5586, 0.5871, 0.6157, 0.6474, 0.6643, 0.6866, 0.7107, 0.7401, 0.7731, 0.8005, 0.8309, 0.8589, 0.8895, 0.9169, 0.9488, 0.9807, 1.0087, 1.0397, 1.0705, 1.1016, 1.1224, 1.1534, 1.1837, 1.2154, 1.2431, 1.2706, 1.3065, 1.3351, 1.3652, 1.3963, 1.4234, 1.4486, 1.4773, 1.5029, 1.5266, 1.5509, 1.5752, 1.6026, 1.6311, 1.656, 1.6835, 1.712, 1.74, 1.7689, 1.7905, 1.8183, 1.8401, 1.8607, 1.8896, 1.9205, 1.949, 1.9751, 2.0041, 2.0334, 2.0634, 2.091, 2.1256, 2.1573, 2.1895, 2.2188, 2.2516</extendedData>
</extendedDataList>
Each of these values represents the distance traveled in 10 seconds. Save the data only as a text file.
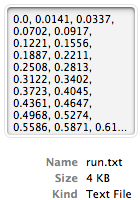
- Import the comma-separated list of numbers into Excel. The values 0.0 to will appear in a single row (row 1).

- Transpose that row. Select row. Copy. Select cell A2. Paste Special. Check Transpose.
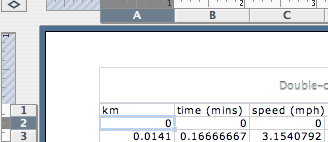
- Delete original row (row 1) and replace it with a blank row. Enter for A1, A2 and A3: km, time (mins), and speed (mph), and zeros for B2 and B3. See below:
- Populate columns B and C.
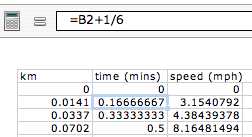
Formula for cell B3 is simply the value of the previous cell (B2) + 1/6 of a minute, i.e. ten seconds. Copying this for the whole column gives the time in minutes.
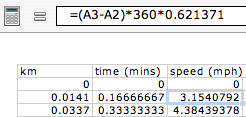
 The speed in mph for cell C3 is simply the distance traveled in 10 seconds (i.e. A3-A2) multipled by 360 (convert to hours) and by 0.621371 (convert km to miles). Copying this for the whole column gives the speed in mph.
- Plot the chart.
Select columns B and C. Insert Chart. Select XY scatter (connected by lines).
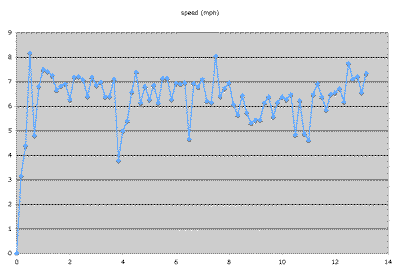
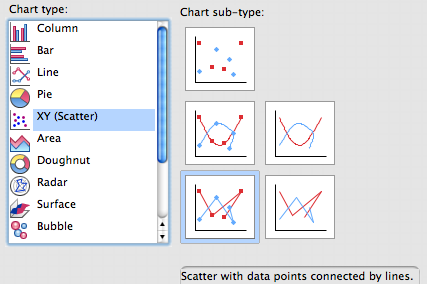 Take the defaults and you have a detailed chart.
Monday, May 7, 2007
Excel and the Nike+ iPod Sport Kit
As I've mentioned in a previous blog entry (On the treadmill), it's possible to extract the run data recorded by the Nike+ iPod Sport Kit and plot it yourself.
One advantage of this is that you don't get the overly smoothed plot from the Nike+ uploads.
Here are the steps. First, I assume the iPod nano has been synced (and the data automatically uploaded to the Nike+ website).
Subscribe to:
Post Comments (Atom)

How do I extract that file from the iPod? In the Finder window, I do not have an option to select the folder you mention above. Thanks.
ReplyDeleteYou can get there using Terminal.App. For example, on my setup, it's:
ReplyDelete/Volumes/Sandiway Fong’s iPod/iPod_Control/Device/Trainer/Workouts/Empeds/4H752A0DVSX/synched
In Finder (in 10.6) iPod_Control is not easily visible.
You can use TextEdit to get the file though via the Open.. dialog box.
Select the iPod and then press the command, shift and . (period) key all at the same time. The list of files/folders displayed will now change.
Another method..
ReplyDeleteIn Terminal.App execute the command
defaults write com.apple.finder AppleShowAllFiles TRUE
After that, bring up "Force Quit Applications" using Command-Option-Esc
and Relaunch the Finder. Now the Finder will show hidden files all the time.
To go back to the original Finder display (no hidden files), use the command:
defaults write com.apple.finder AppleShowAllFiles FALSE
Awesome. Thanks.
ReplyDeletevery informative. thanks! discount sports tickets
ReplyDelete